Visualization Module
Overview
The Visualization Module allows users to create and manage data visualizations through a flexible interface.
This guide covers module creation, configuration, and management for both simple visualizations and grouped visualization sets.
1. Visualization Module Creation
To create a new visualization module, navigate to the Modules page.
Click the Create a new module button to initiate the creation process. A form will appear prompting you to enter:
- Label – User-friendly name for your module.
- Type – Module type
"Visualization". - ID – Auto-filled from label (used in URL paths; must contain no spaces).
Note: The Label can be a short display name, while the Title (configured later) is more descriptive.
Once filled, click Create. This opens the module configuration screen.
2. Basic Configuration
Core Configuration
Configure in General configuration :
- Label
- Title
- Short Description
- Description
- Categorize visualization into groups (Checkbox – default: unchecked) Leave unchecked for flat/non-grouped layout.
Adding Visualizations
Click Manage visualization to add new visualizations and configure their layouts. Afterwards click Add Visualization to add a new visualization. You must specify:
- Type of visualization
- Name of visualization
- Caption detailing the visualization selected
You can add as many visualizations as needed.
Once you’ve added visualizations, you can adjust and arrange visualizations for different screen sizes.
- Use the Screen Size Dropdown to configure layouts per device (e.g., mobile, tablet, desktop).
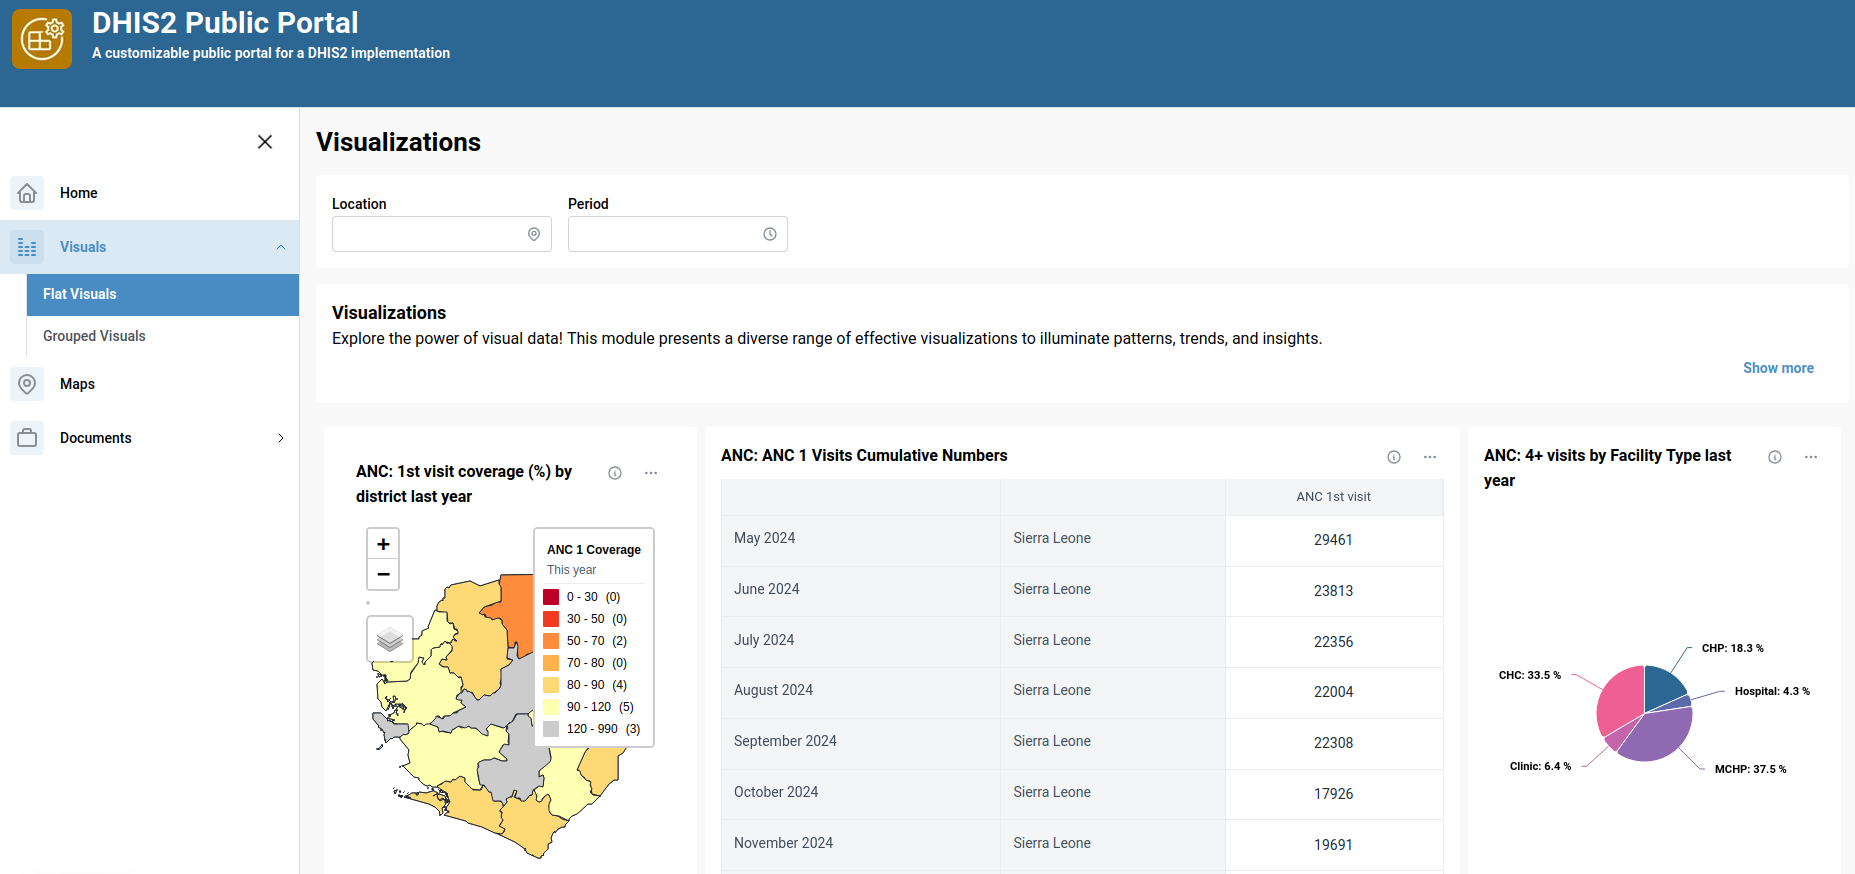
Expected Outcome:
3. Grouped Configuration
Use this setup if you want to organize visualizations into categories or tabs.
Group Setup
Enable Categorize visualization into groups checkbox
When Categorize visualization into groups is checked additional UI elements will appear:
Group Selector
Choose between:
- Segmented – Groups appear as segmented buttons
- Dropdown – Groups appear in a dropdown menu
Creating Groups
Click + Add Group to open a new group form
Fill in:
- Group Title: Display name
- Short Name: Compact identifier
- ID: Auto-filled from title Click Create Group to save it
Group Configuration
After creating a group, configure the following:
- Short Description
- Description
You can then manage visualizations to the group using the same process:
- Add Visualization – Select type, name, and caption.
- Configure Layout – Adjust for screen sizes.
- Save Changes – Ensure changes are applied.
You can:
- Add more groups
- Edit existing ones
- Delete unwanted groups
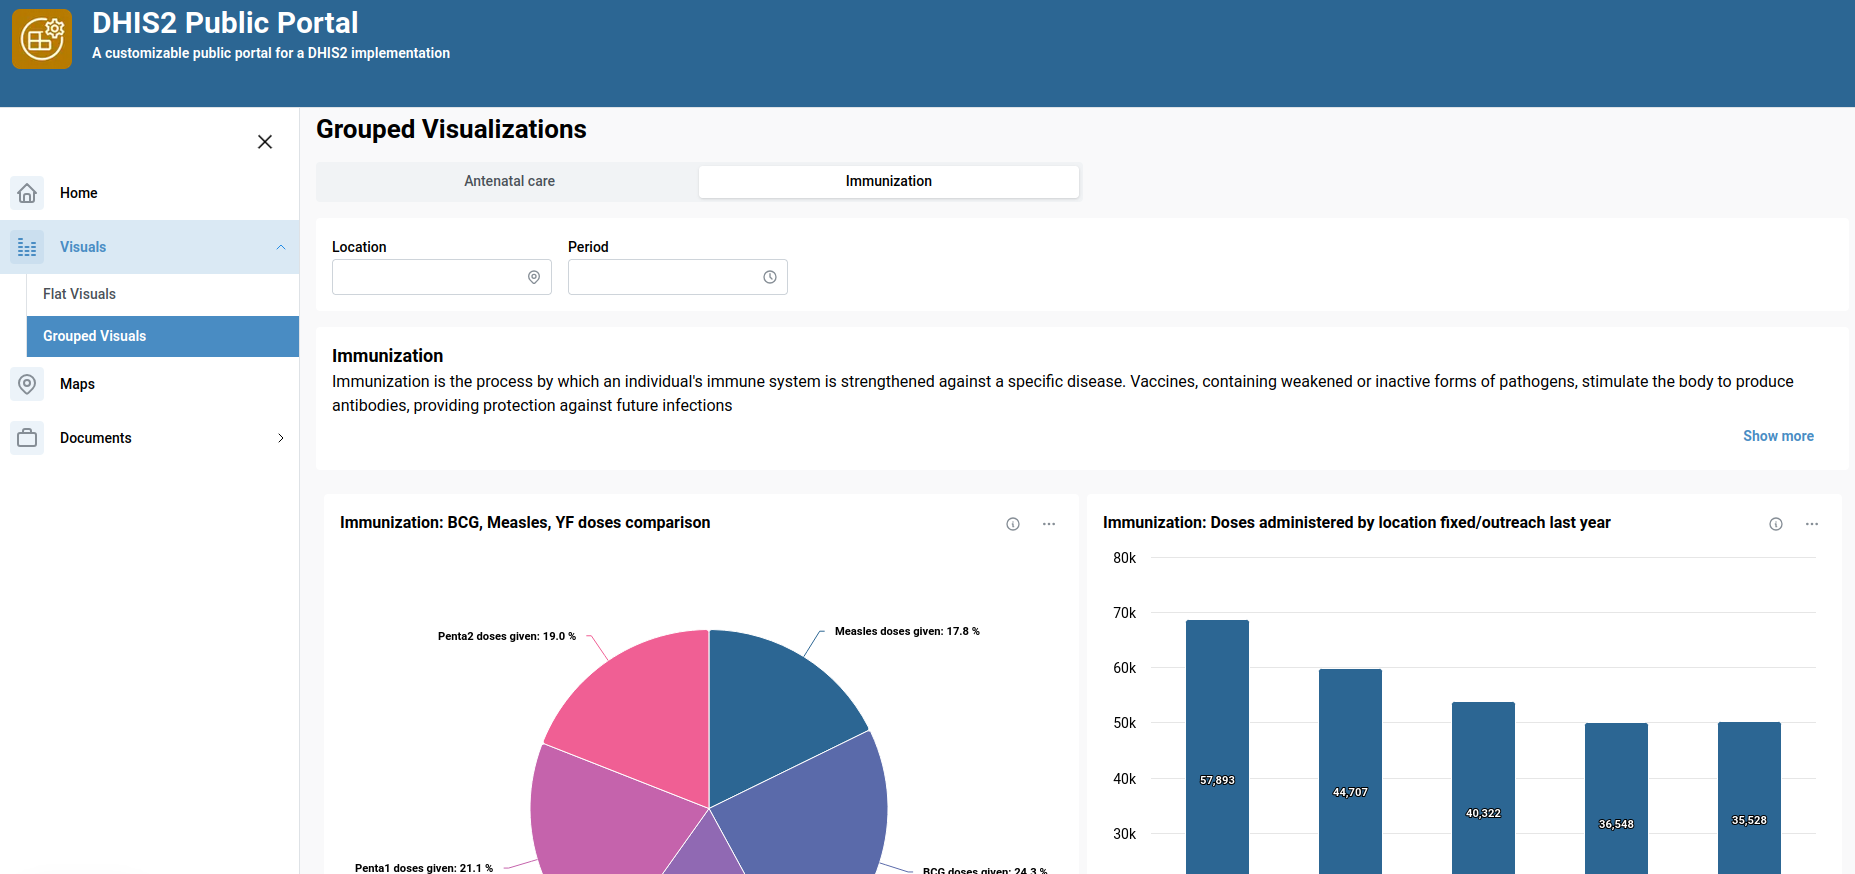
Expected Outcome:
4. Deleting a Module
Modules can be deleted entirely from the module overview screen.
⚠️ Warning: Deleting a module will remove all its visualizations and groups permanently.
5. Summary
| Feature | Description |
|---|---|
| Create Module | Define label, type, and ID |
| Configure Layout | Customize visualization layout for multiple screens |
| Categorize visualization into groups | Toggle between grouped and flat visualizations |
| Add/Edit/Delete | Full CRUD control on visualizations and groups |
| Responsive Design | Layouts optimized per screen size |
6. Best Practices
- Always use URL-safe IDs (no spaces or special characters).
- Regularly save progress during configuration.
- Organize groups meaningfully when using group mode.
- Test layouts on multiple screen sizes to ensure optimal display
💡 Got ideas or suggestions? Reach out to the team to request new features!