
Read executions
An execution is one run of a pipeline. Every run is recorded, whether you triggered it, something called the API, or a schedule fired. Each execution keeps its own status, its step-by-step record, and its logs.
Before you start
Section titled “Before you start”You can open CAPS. A run exists after you trigger a pipeline or a schedule fires.
Where to look
Section titled “Where to look”On the pipeline. Open the pipeline and select Executions. This lists only that pipeline’s runs. Use it to check one pipeline, or to see whether its schedule is firing.

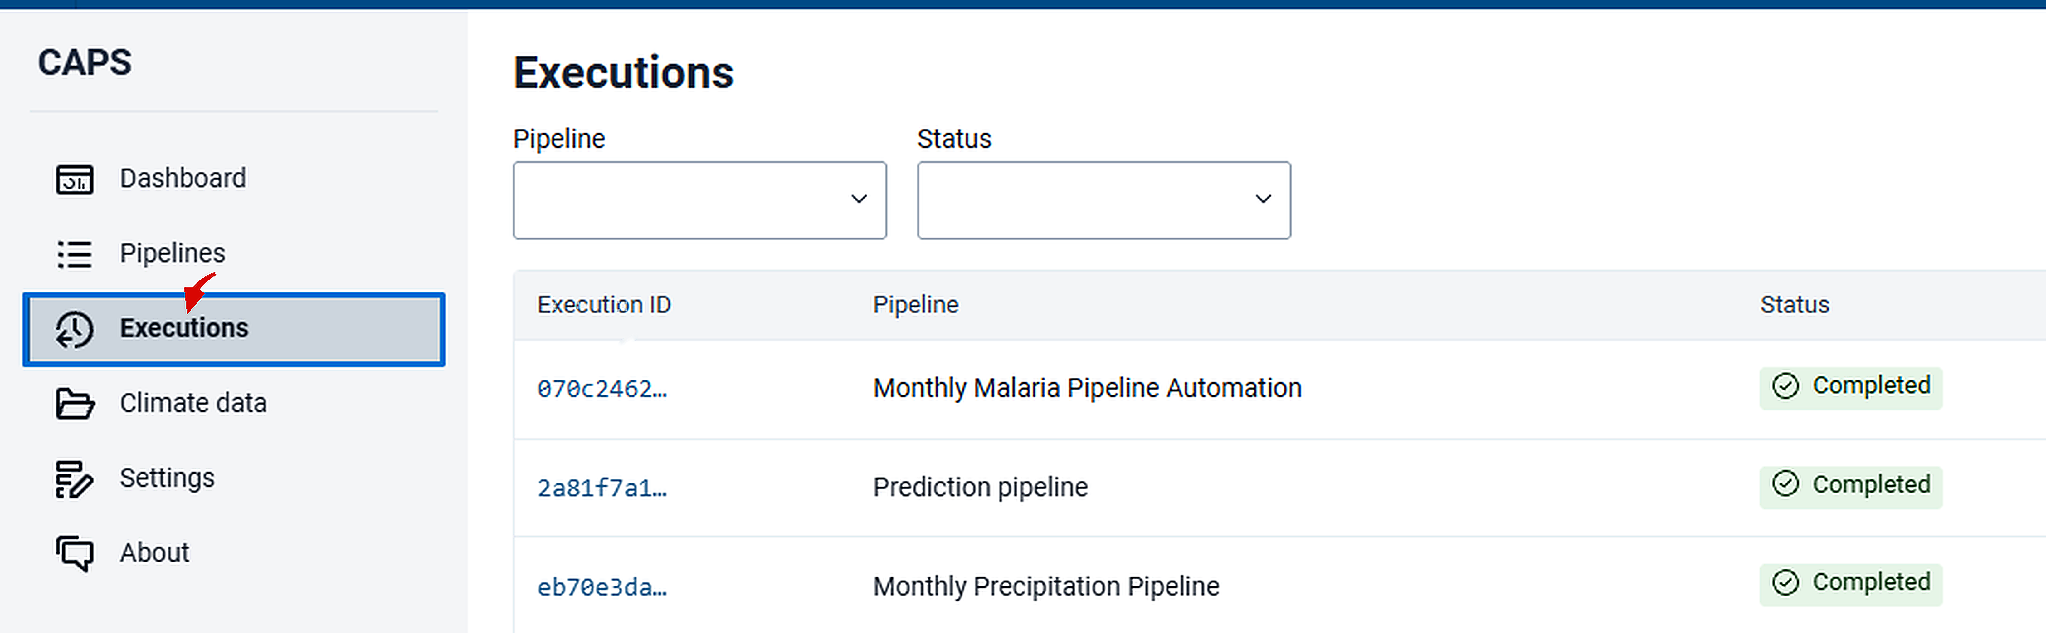
Across the installation. Click Executions in the left navigation. Each row names its pipeline. Use this for a daily check, or when something failed and you do not yet know which pipeline.
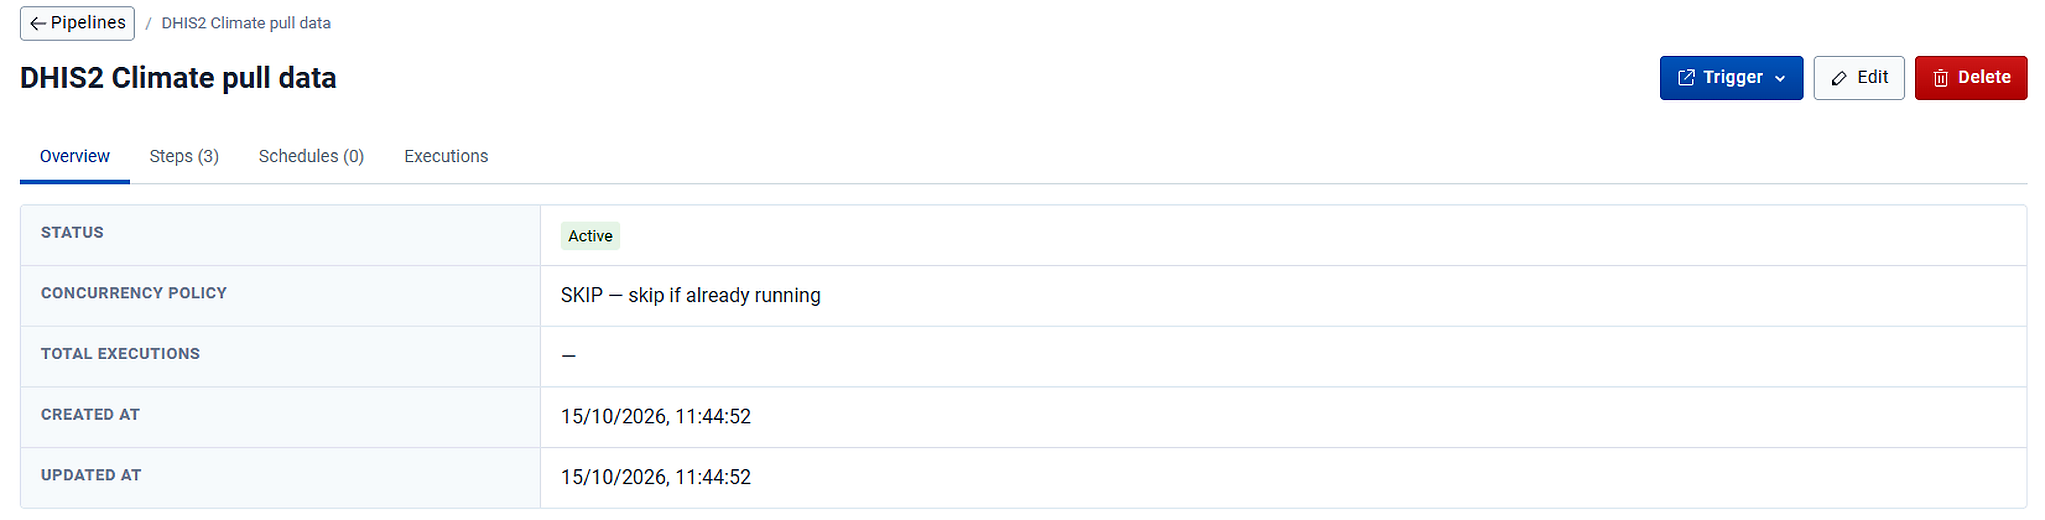
On Overview. A pipeline’s Overview tab has Total executions. That field is a count, not a list. A dash means the pipeline has never run. Overview is also where the concurrency policy is shown. That policy is the execution behaviour you chose when you created the pipeline.
When a pipeline has never run
Section titled “When a pipeline has never run”The pipeline’s Executions tab shows No executions. This pipeline has not been executed yet.

That is expected for a pipeline you just built. If the pipeline has an active schedule and this panel is still there, the schedule has not fired. Check Schedules.
Columns
Section titled “Columns”
| Column | What it shows |
|---|---|
| Status | How the run ended, or where it has reached |
| Triggered By | api for a run started by hand or through the API. scheduler for a run started by a schedule. |
| Started At | When the run began |
| Duration | How long it took, or how long it has taken so far. A run much longer than usual points at a slow external service. |
| View | Opens the execution |
In the Executions section the first column is Execution ID, and that identifier is the link. View at the end of a row on the pipeline tab opens the same page.
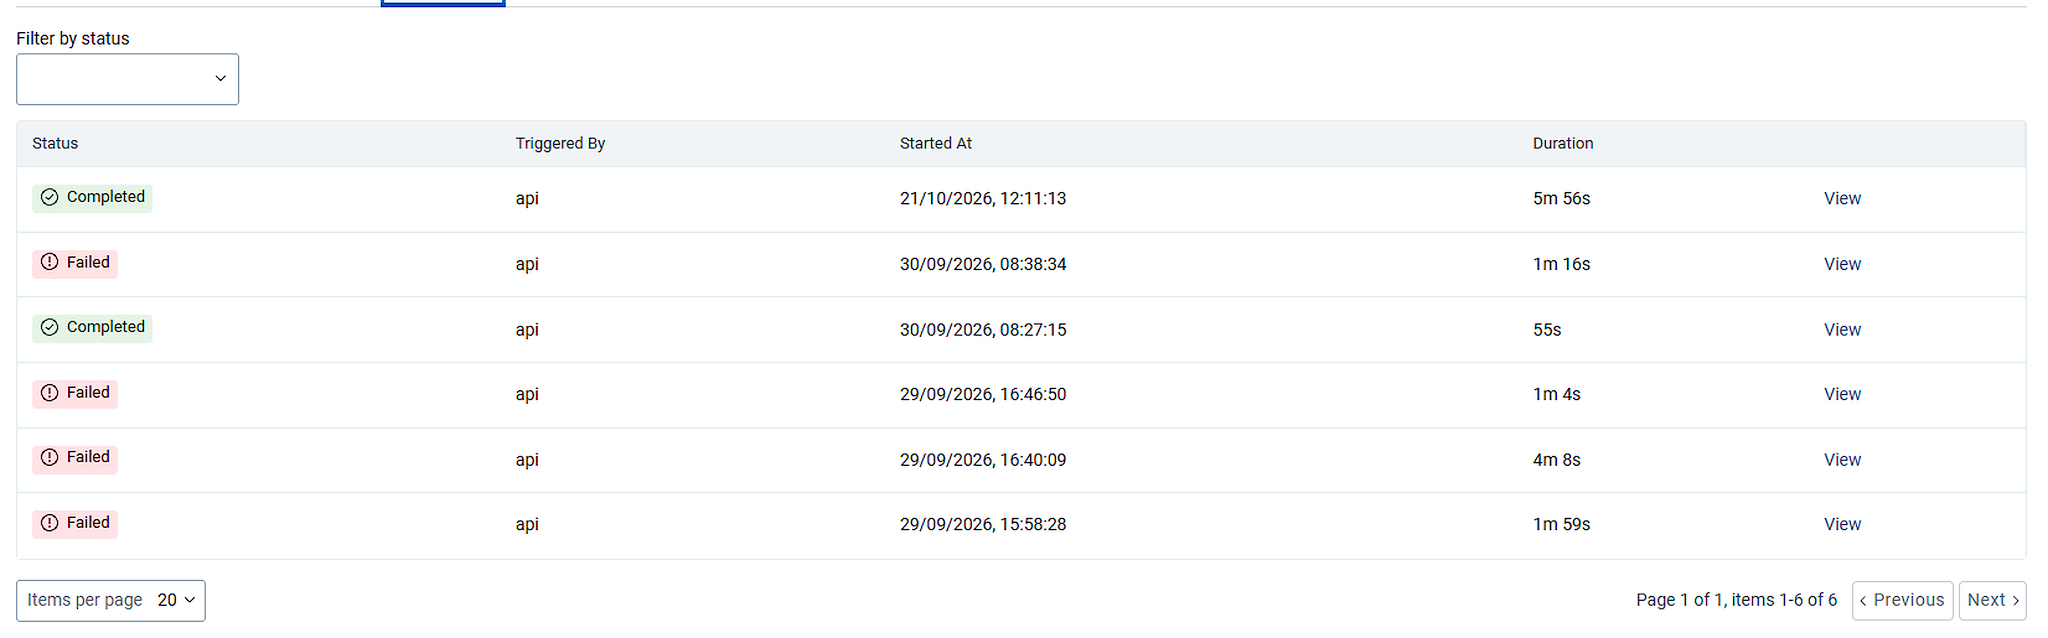
Runs are listed newest first, so the top row is the latest attempt. Several failures followed by a success is the usual shape of a pipeline being corrected: the failures are earlier attempts, and the completed run at the top is the current state. The shape to investigate is the reverse, where recent runs fail after a period of success. Something outside the pipeline has changed.
Status
Section titled “Status”| Status | Meaning |
|---|---|
| Pending | The run has been created and is waiting to begin |
| Running | Steps are being carried out |
| Awaiting Step | The run is waiting on a step that handed work to another service, such as a prediction or an analytics run |
| Completed | Every step finished successfully |
| Failed | A step did not succeed after its retries were exhausted |
| Cancelled | Someone stopped the run before it finished |
| Paused | The run is held at its current step until it is resumed |
Completed, Failed, and Cancelled are final. The others describe a run still in progress.
Filter and page
Section titled “Filter and page”A pipeline’s Executions tab has one filter, by status. The Executions section has two, and they combine: status, and pipeline.

Filter by status lists every status, with All statuses at the top.
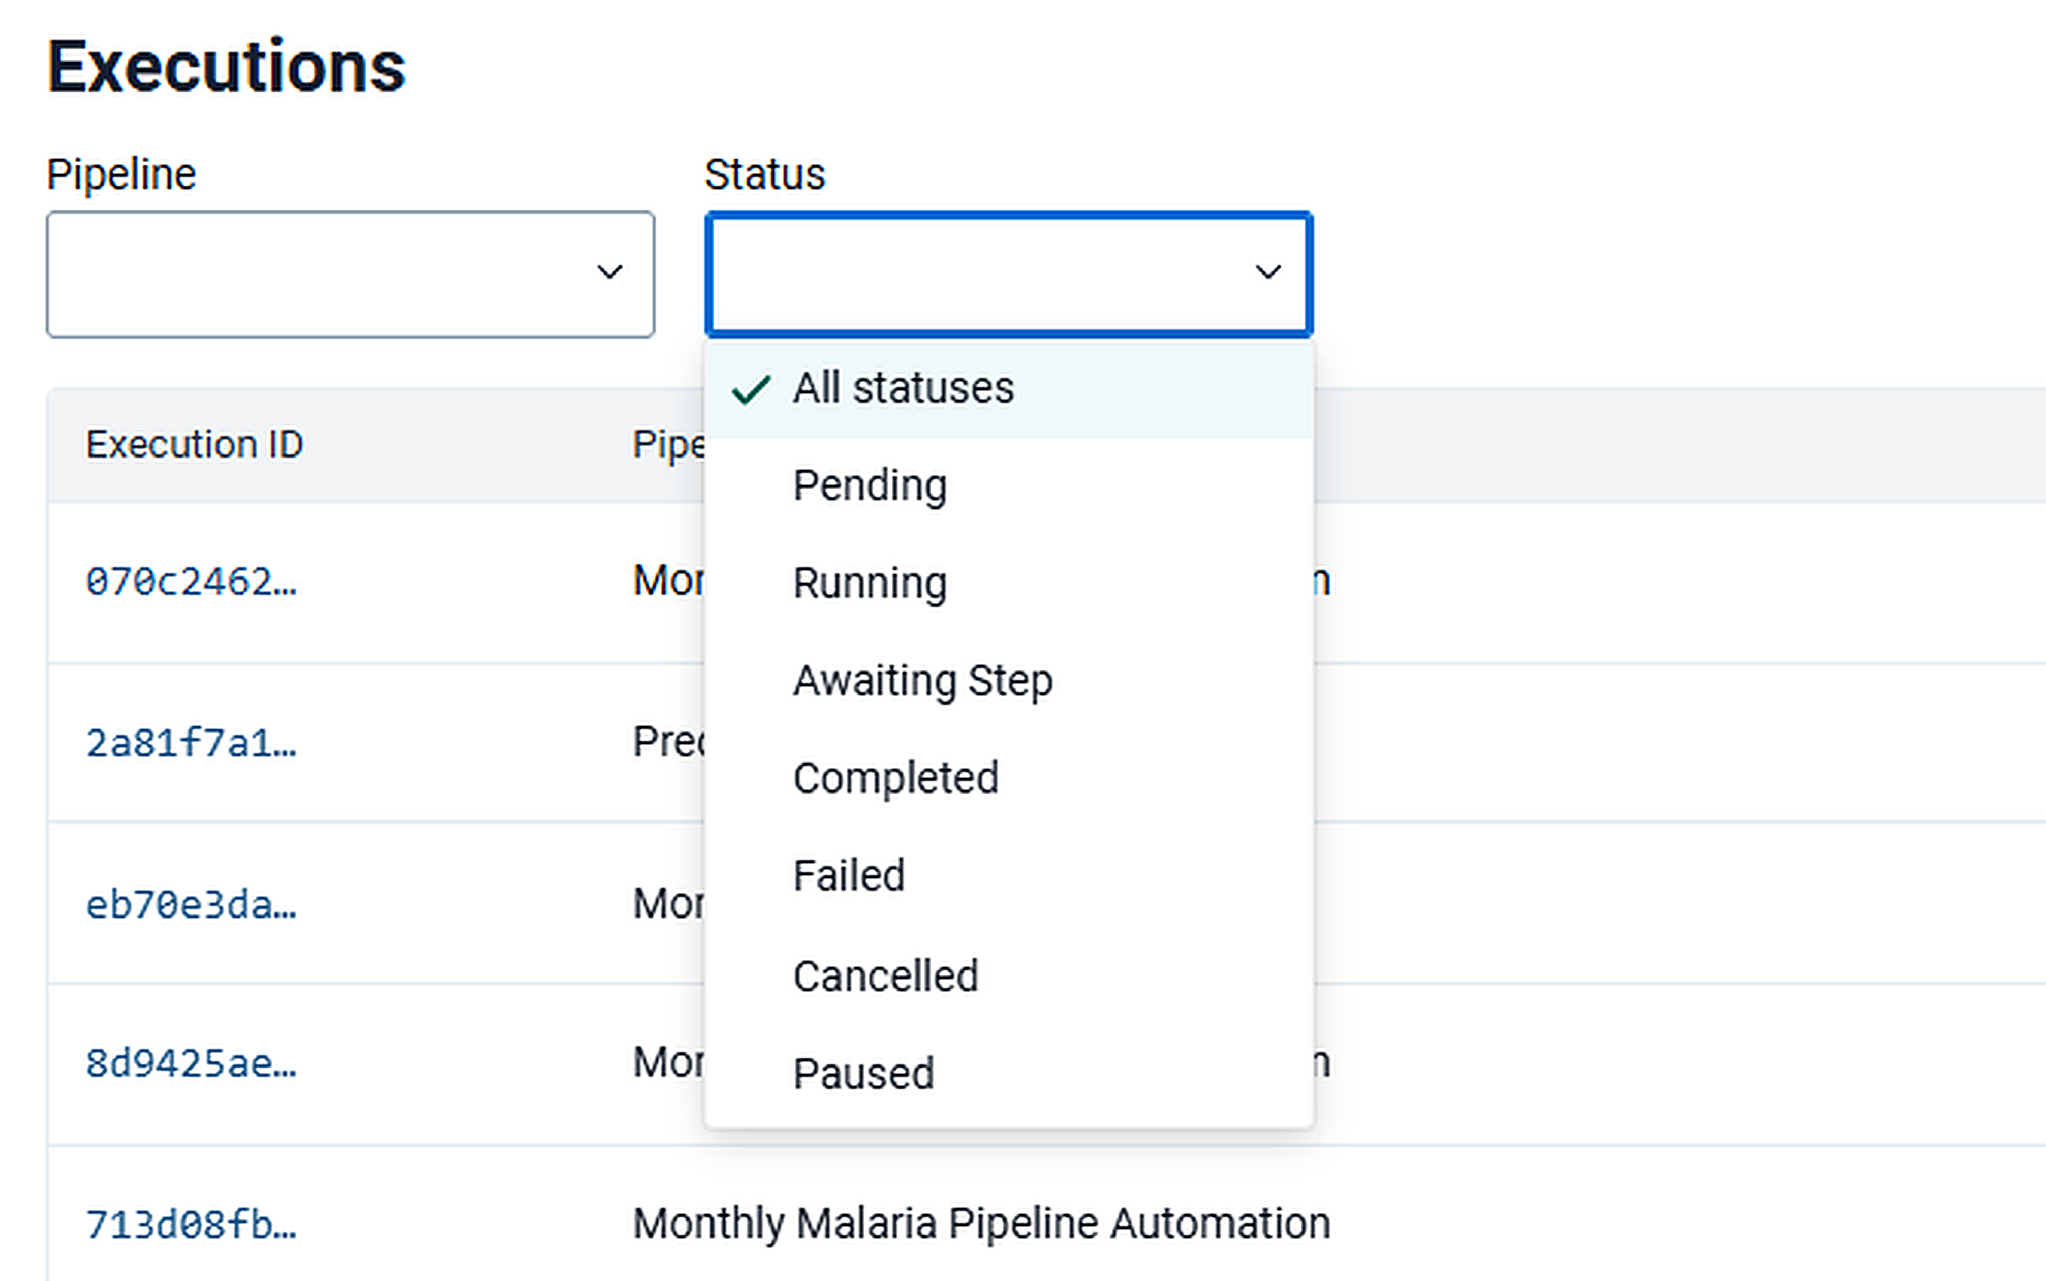
The seven values are Pending, Running, Awaiting Step, Completed, Failed, Cancelled, and Paused, in the order a run passes through them. Failed is the short list of what needs attention. Running and Awaiting Step together show what is in progress, which is worth checking before you trigger a pipeline that uses Skip or Replace.
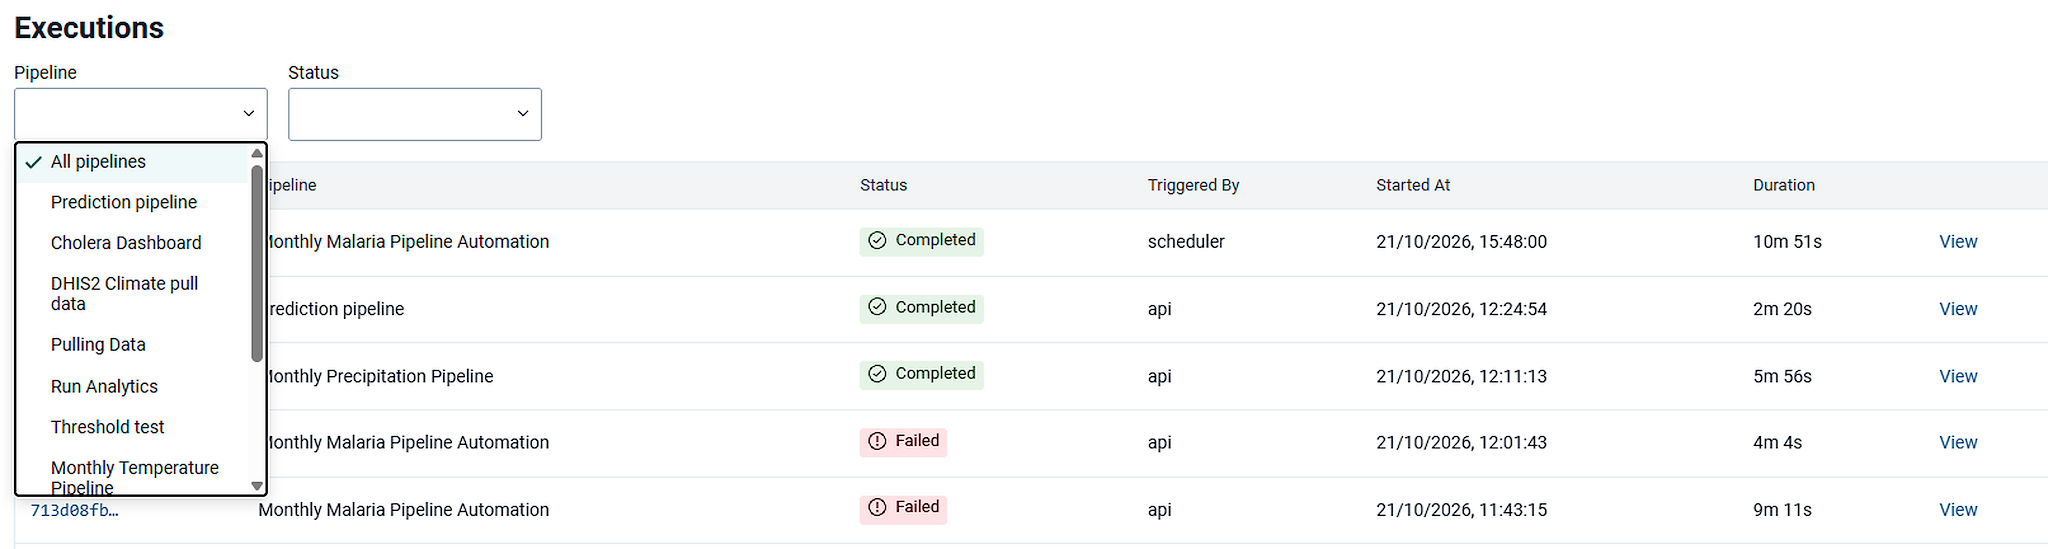
Filter by pipeline is only on the Executions section, to the left of the status filter. It lists every pipeline, with All pipelines ticked by default. Selecting one pipeline and Failed is the same view as that pipeline’s own Executions tab filtered to Failed.

Items per page sets how many rows are shown. The counter states the range and the total, for example Page 1 of 1, items 1-6 of 6. Previous and Next move between pages.

You can open the newest run from View or from its Execution ID. The next page is One execution.
If the status is Failed, follow Trace a failure.