
The CAPS screens
CAPS opens inside DHIS2. The left navigation is the same on every screen.
Before you start
Section titled “Before you start”CAPS is installed and Settings shows Connected. That check is Check the install.
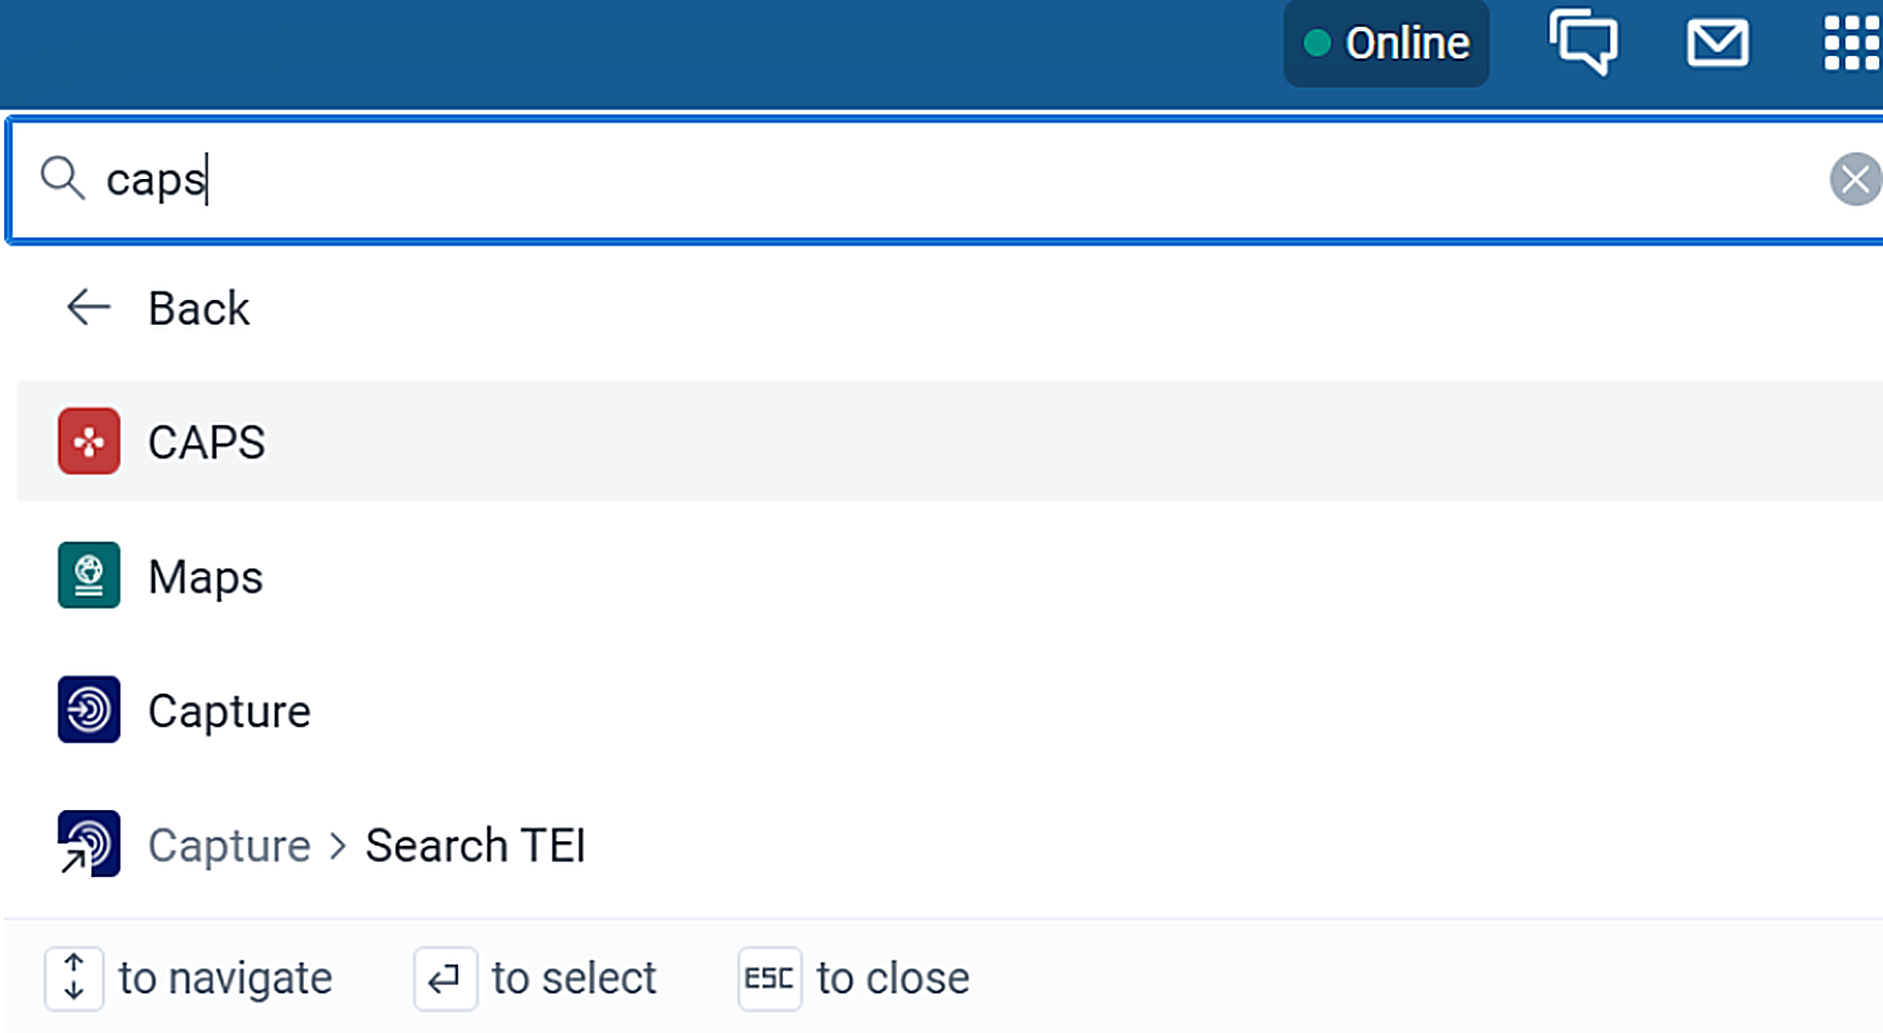
- Open the App Menu.
- Search for CAPS.
- Click CAPS.
The left navigation has these areas:
- Dashboard shows how many pipeline runs there are, how many completed or failed, and which pipelines are running or waiting. It also summarises stuck executions and recent failures.
- Pipelines lists the pipelines you have created. From here you create a pipeline, or run, edit, or delete one. See Create a pipeline.
- Executions lists runs across every pipeline. Filter by pipeline name or by status: All, Pending, Running, Awaiting Step, Completed, Failed, Cancelled, or Paused. See Read executions.
- Climate Data lists climate datasets imported from the Open Climate Service and is where you import another dataset. See Import climate data.
- Settings and About are where you manage connections. Settings is where you connect another DHIS2 instance. About shows each connected instance as a card. Service URLs for CHAP, the climate service, and this DHIS2 instance are set during install, on CHAP, climate, and DHIS2.
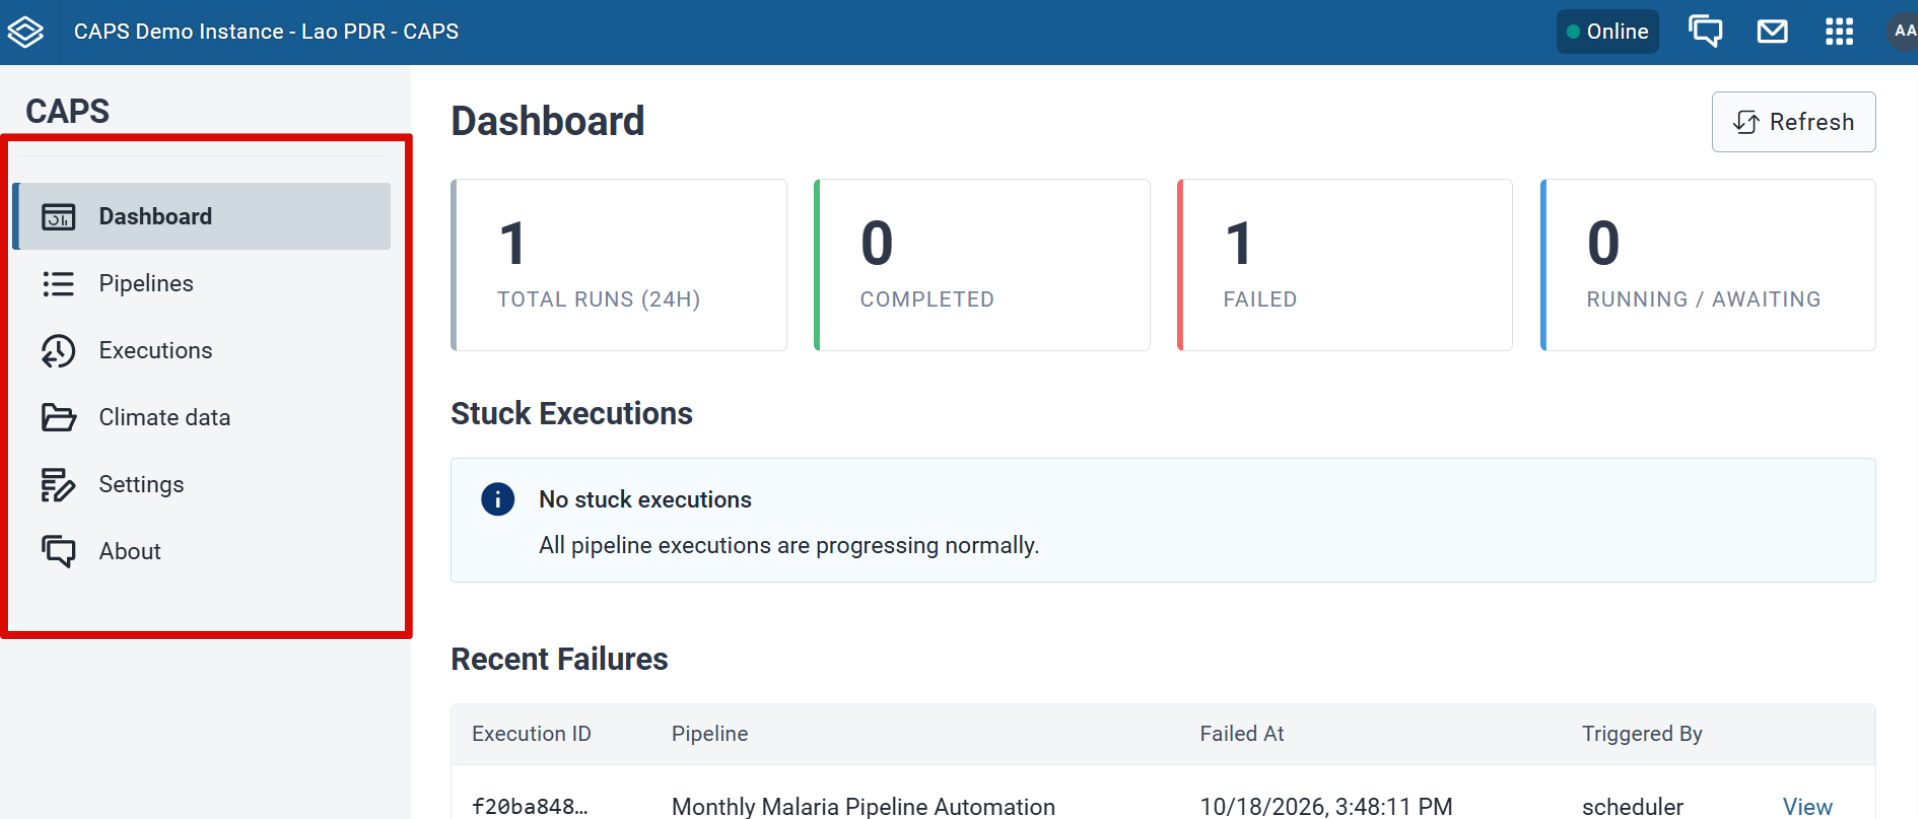
Dashboard, Pipelines, Executions, Climate Data, Settings, and About all open from the left navigation.
Prepare the data before you build a prediction pipeline.