
Run a prediction
This pipeline runs a monthly malaria prediction. Your model may use different covariates. Repeat the create, poll, download, and upload block once for each covariate in the prediction setup.
Before you start
Section titled “Before you start”- The pipeline exists and is open on Steps. See Create a pipeline.
- Climate datasets are imported.
- An evaluation is approved and has a prediction setup.
- Data elements exist for the covariates and the forecast quantiles. See Data elements and datasets.
- Case data is already on this instance, or a pull pipeline has copied it here.
Shared fields on every step — name, retries, and retry delay — are on Create a pipeline. The names below are examples.
1. Sync climate datasets
Section titled “1. Sync climate datasets”This step refreshes the datasets you already imported. Name, Max retries, and Retry delay (ms) are on Create a pipeline.
- Click Add step and name it.
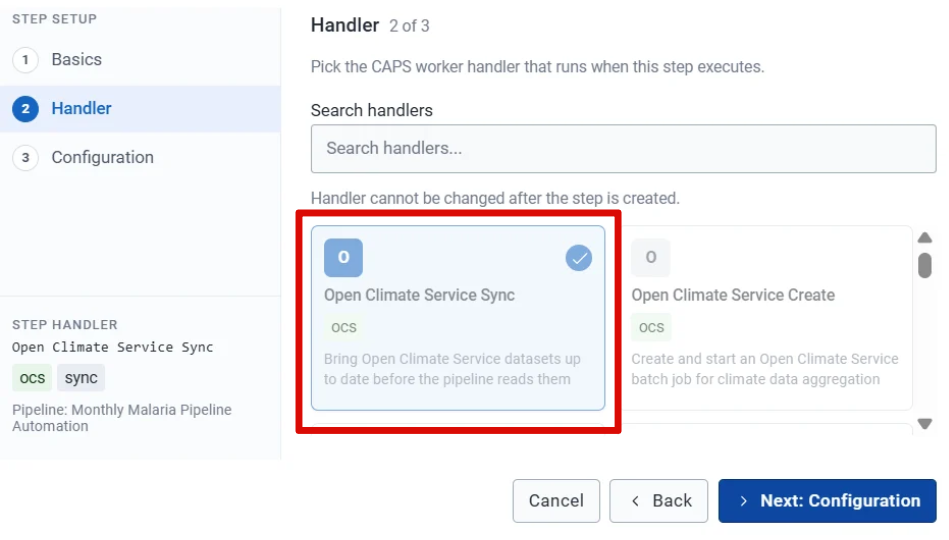
- Under Handler, select Open Climate Service Sync.
- Under Configuration, select the climate datasets to synchronise.
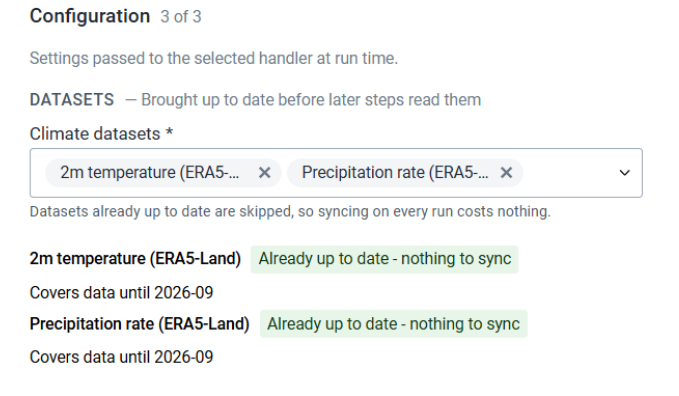
- Choose what happens if a dataset fails to synchronise.

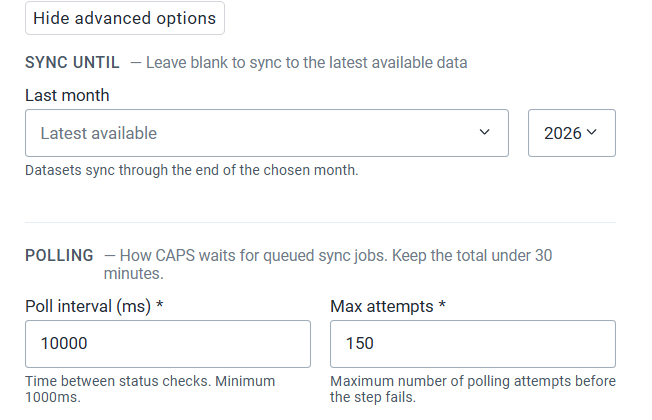
- Under Advanced Options, set the period to synchronise up to. Leave it blank to use the latest available period.
- Set the poll interval and the maximum number of attempts for queued synchronisation jobs.
- Click Add step.
2. Request a covariate
Section titled “2. Request a covariate”This step asks for one covariate, such as temperature. Repeat it later for each remaining covariate.
- Click Add step. Name it, for example Request Temperature Data.
- Under Handler, select Open Climate Service Create.
- Select the climate dataset.
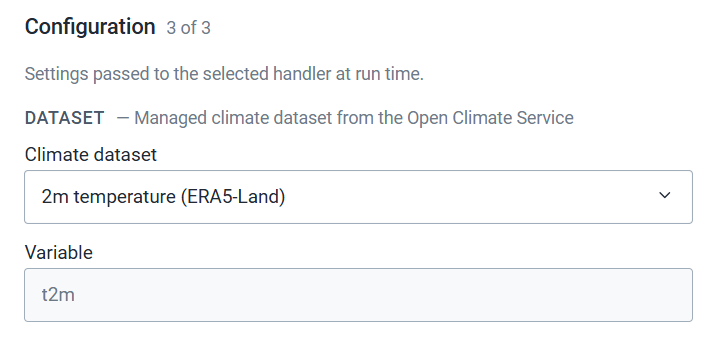
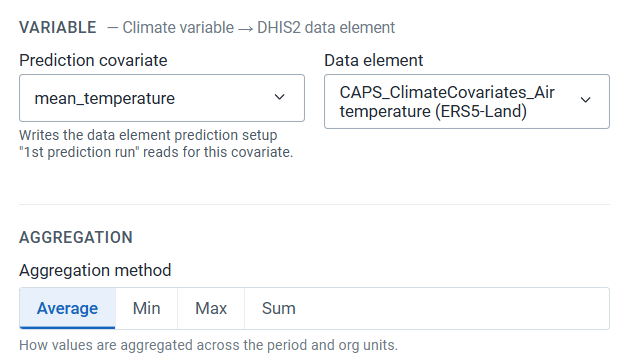
- Select the prediction covariate, for example
mean_temperature. The matching DHIS2 data item is filled in. - Select the aggregation method, for example Average.
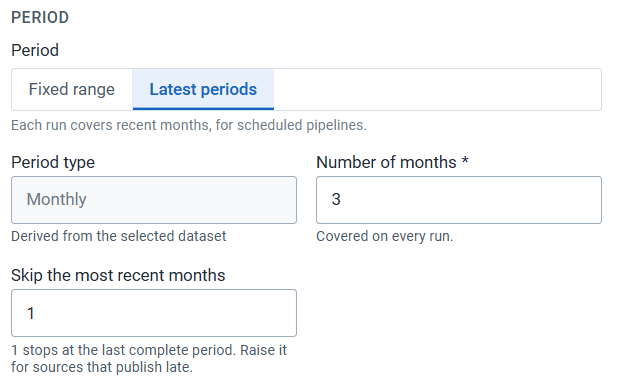
- Select the period.
- Fixed Range uses a start and an end you type.
- Latest Period counts backwards from the current period. Three monthly periods in October 2026 cover July to September 2026.
- Skip the Most Recent Months leaves out months that are still incomplete.
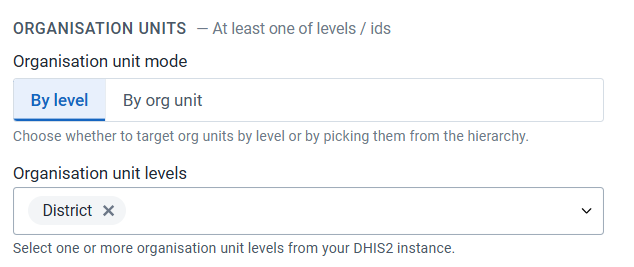
- Select organisation units by level, or pick units from the hierarchy.
- Click Add step.
3. Poll the covariate request
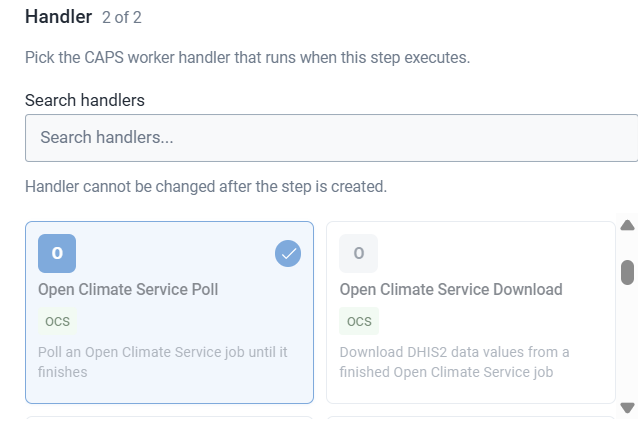
Section titled “3. Poll the covariate request”- Click Add step. Name it, for example Poll Temperature Data.
- Under Handler, select Open Climate Service Poll.
- Click Add step.
The step checks the request from the previous step until that request is ready.
4. Download the covariate
Section titled “4. Download the covariate”- Click Add step. Name it, for example Download Temperature Data.
- Under Handler, select Open Climate Service Download.
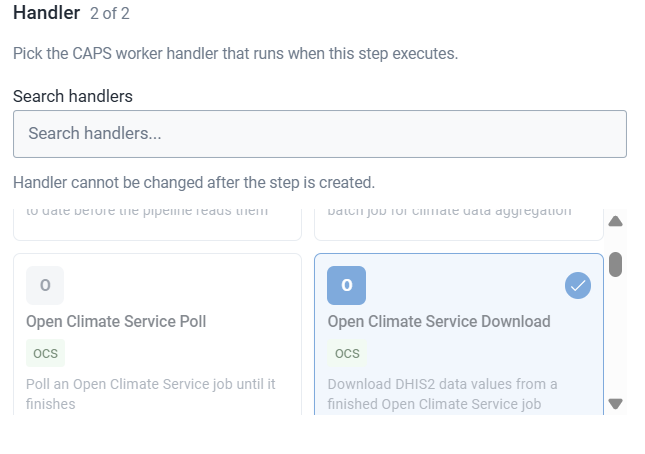
- Click Add step.
The download is in a form DHIS2 can import.
5. Upload the covariate
Section titled “5. Upload the covariate”- Click Add step. Name it, for example Upload Temperature Data to DHIS2.
- Under Handler, select DHIS2 Data Upload.
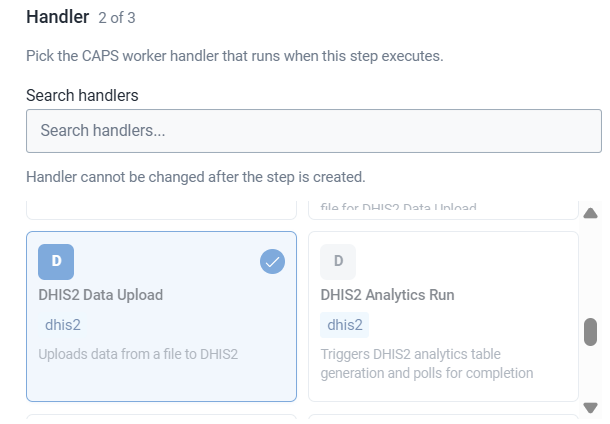
- Select the import strategy.
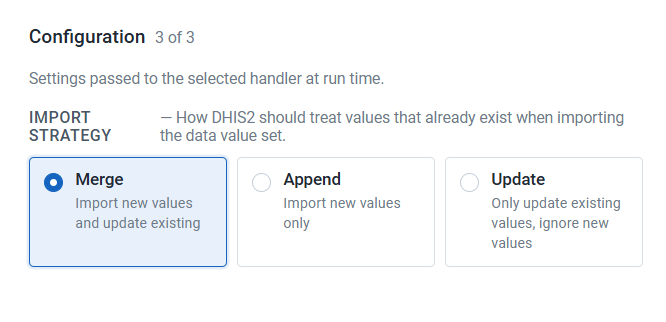
- Click Add step.
6. Repeat for each remaining covariate
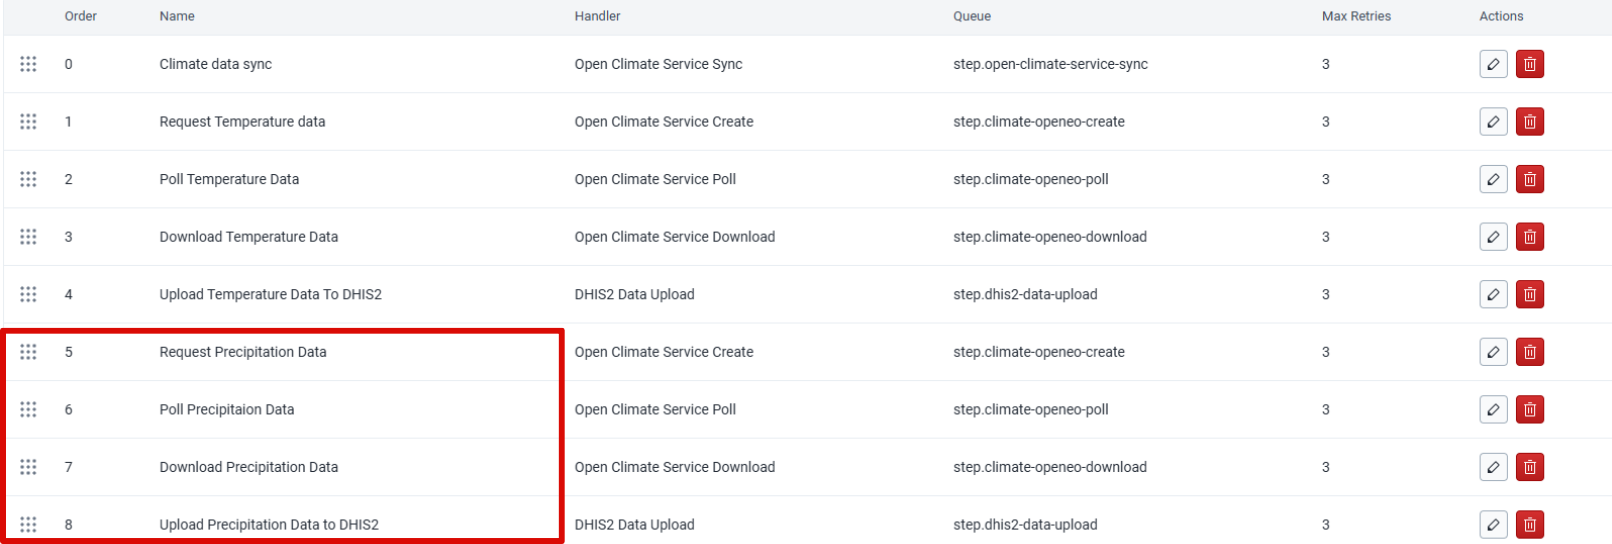
Section titled “6. Repeat for each remaining covariate”Repeat steps 2 to 5 for every other covariate in the prediction setup. This example uses temperature and precipitation, so the second pass selects the precipitation covariate and names the steps accordingly.
7. Run analytics
Section titled “7. Run analytics”Analytics makes the uploaded covariates available for the prediction.
- Click Add step. Name it, for example Run Analytics.
- Under Handler, select DHIS2 Analytics Run.
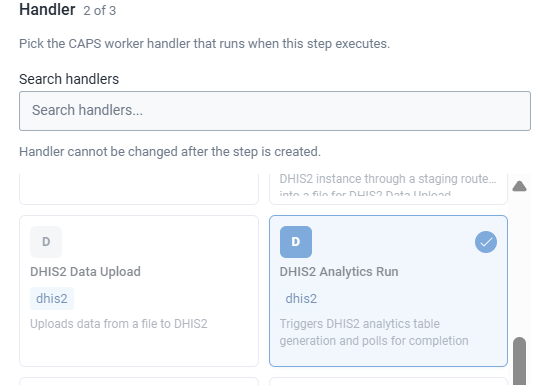
- Set Last years, for example All, and the polling fields Poll interval (ms) and Max attempts.
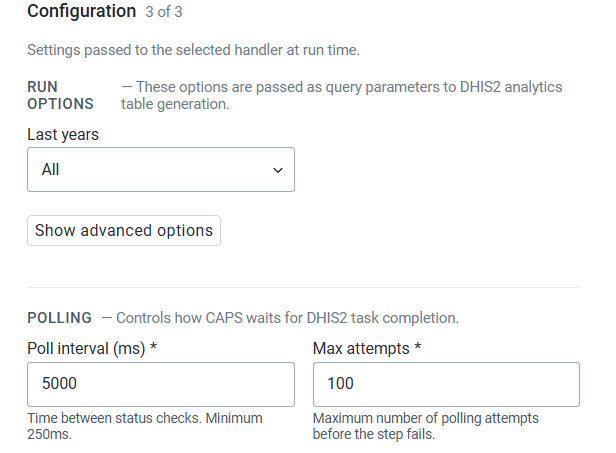
- Click Add step.
8. Trigger the prediction
Section titled “8. Trigger the prediction”- Click Add step. Name it, for example Run CHAP Prediction.
- Under Handler, select Prediction Trigger.
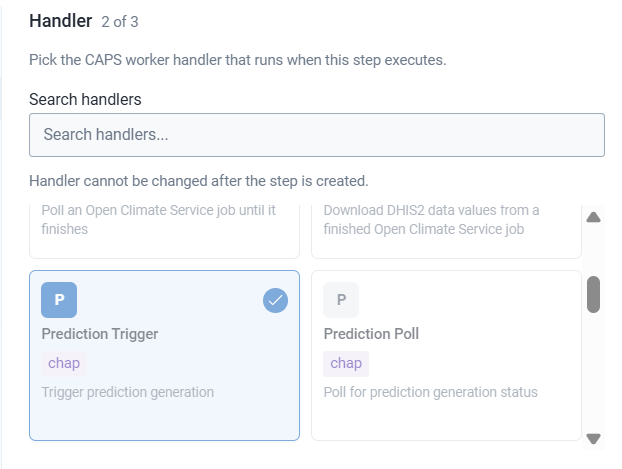
- Select the model evaluation approved in the Modelling App. The prediction setup name is filled in.
- Enter a job name. CHAP uses this name for the prediction job.
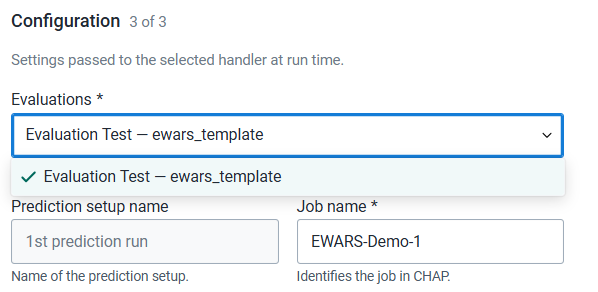
- Select the training period and the number of periods to forecast.
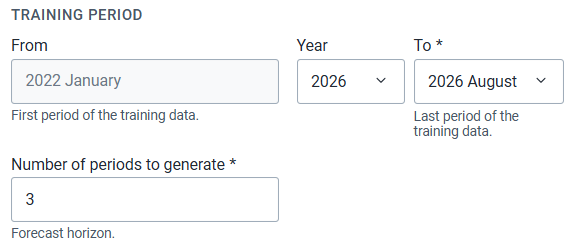
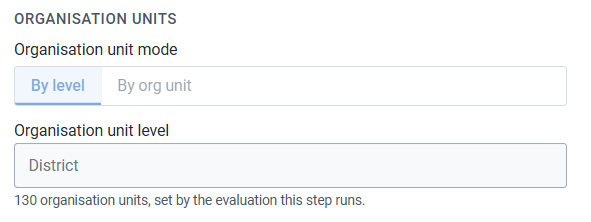
- Select organisation units by level, or pick them from the hierarchy.
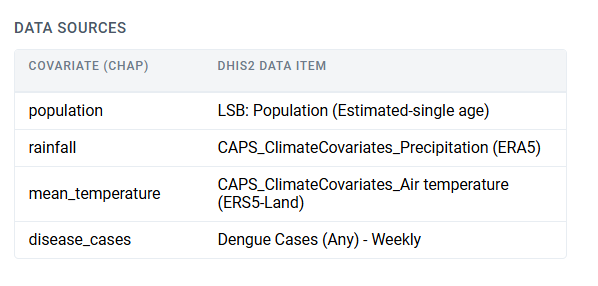
- Review the covariates and the DHIS2 data items shown in the configuration.
- Click Add step.
9. Poll the prediction
Section titled “9. Poll the prediction”- Click Add step. Name it, for example Poll CHAP Prediction.
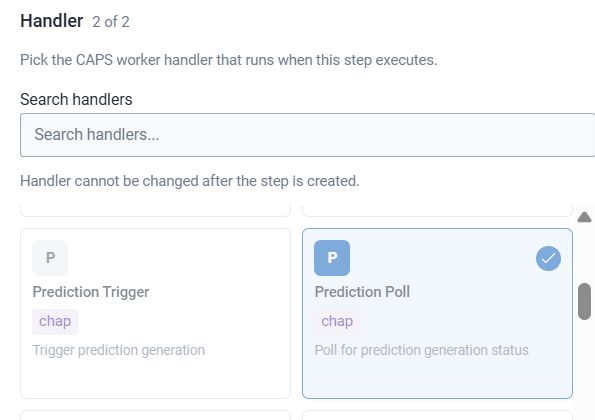
- Under Handler, select Prediction Poll.
- Click Add step.
10. Download the forecast
Section titled “10. Download the forecast”- Click Add step. Name it, for example Download CHAP Prediction.
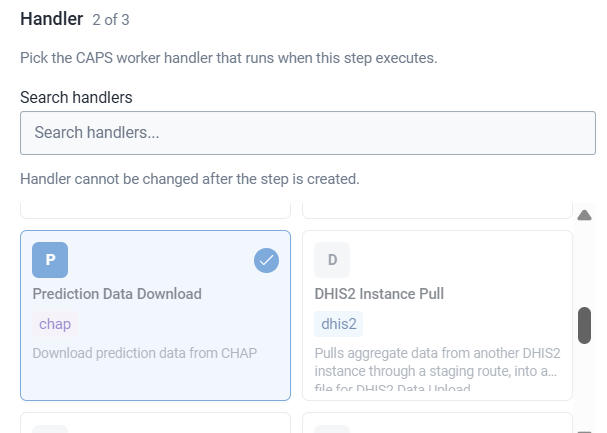
- Under Handler, select Prediction Data Download.
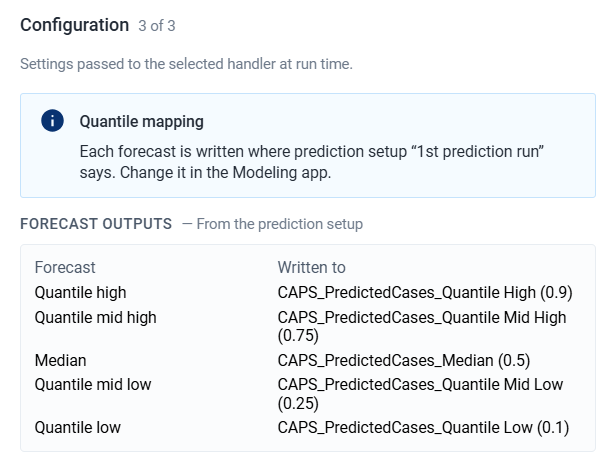
- Review the forecast outputs and where they will be written.
- Click Add step.
11. Upload the forecast
Section titled “11. Upload the forecast”- Click Add step. Name it, for example Upload Prediction to DHIS2.
- Under Handler, select DHIS2 Data Upload.
- Select the import strategy for the prediction results. The control is the same import strategy as the covariate upload above.
- Click Add step.
Drag the nine-dot handle if a step is out of order. For two covariates the order is: sync, then temperature create-poll-download-upload, then precipitation create-poll-download-upload, then analytics, trigger, poll, download, and upload.
Steps lists every covariate block, then analytics, then the four prediction steps. After you trigger the pipeline, the forecast values appear in the sectioned dataset in Data Entry.
Schedule the pipeline so each run moves forward to the latest periods.